



Introduction
If you purchase titanium dioxide, you have watched prices move — sometimes sharply — over the past several years. TiO₂ prices rose dramatically in 2021–2022, softened through 2023–2024, and have remained sensitive to raw material supply shocks ever since. Understanding why these fluctuations happen is the first step toward smarter purchasing.
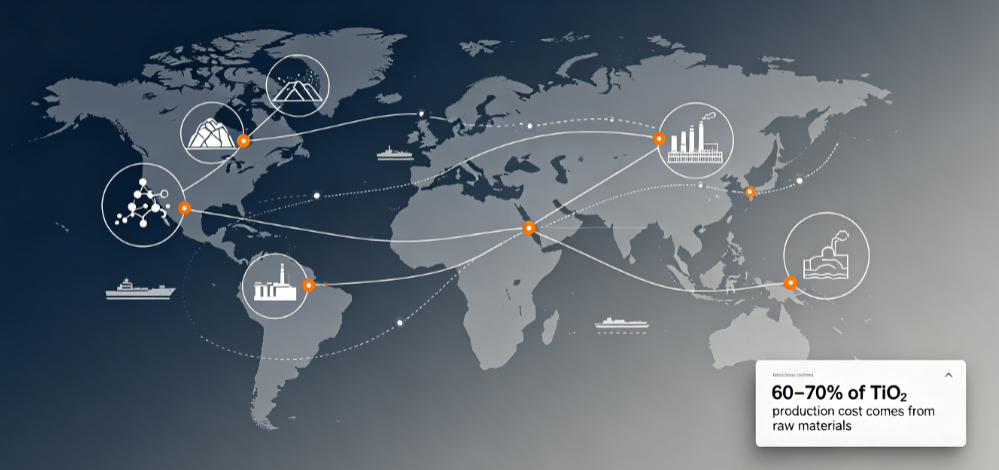
The root cause sits at the very beginning of the supply chain: titanium feedstocks. Roughly 60–70% of the production cost of TiO₂ comes from raw materials — primarily ilmenite, natural rutile, and titanium slag. When feedstock prices move, TiO₂ prices follow, often with a lag of one to two quarters.
This article explains the mechanics of TiO₂ cost transmission, maps the global titanium feedstock supply landscape, and outlines what buyers can expect in the coming quarters based on current mining and production dynamics.
1. The Cost Structure of TiO₂ Production
To understand price movements, start with what goes into producing one tonne of TiO₂. The cost structure varies by process (sulfate vs. chloride) and by feedstock type, but a typical breakdown is:
|
Cost Component |
Sulfate Process Share |
Chloride Process Share |
|
Titanium feedstock (ilmenite/titanium slag) |
55–65% |
50–60% |
|
Energy (electricity, coal, steam) |
15–20% |
15–20% |
|
Sulfuric acid / chlorine |
8–12% |
8–10% |
|
Labor, maintenance, depreciation |
10–15% |
12–18% |
Feedstock dominates both processes. This single fact explains why global TiO₂ price cycles are so closely synchronized with titanium ore markets. When ilmenite prices rise 20%, producers feel an immediate cost pressure of roughly 10–13% on their total production cost — and they pass it downstream.
[Image: Pie chart of TiO₂ production cost structure showing feedstock dominance at 55-65%]
2. The Three Key Feedstocks and Their Markets
Ilmenite (FeTiO₃)
Ilmenite is the most abundant titanium ore and the primary feedstock for the sulfate process and for upgrading to titanium slag. It typically contains 44–60% TiO₂. Global ilmenite production is dominated by a handful of countries:
- • Australia: Largest exporter; mineral sands operations in Western Australia and Queensland (e.g., Murray Basin, Eucla Basin)
- • South Africa: Major heavy-mineral sands producer (Richards Bay Minerals)
- • Mozambique: Rapidly growing producer (Moma deposit, operated by Kenmare Resources)
- • China: The Panzhihua (攀枝花) region in Sichuan is the world’s largest vanadium-titanium magnetite mining area, supplying much of China’s domestic ilmenite
- • Canada, Norway, Madagascar, Senegal: Significant secondary producers
Natural Rutile (TiO₂)
Natural rutile contains 93–95% TiO₂ and is the premium feedstock for the chloride process. Its supply is much more concentrated — Sierra Leone, South Africa, and Australia account for the majority of global output. Rutile commands a significant price premium over ilmenite (often 3–4× per tonne) and its price movements directly affect chloride-process TiO₂ producers like Chemours, Tronox, and Venator.
Titanium Slag (Upgraded Ilmenite)
Titanium slag is produced by smelting ilmenite in electric arc furnaces to remove iron, yielding a product with 75–95% TiO₂. Major producers include Rio Tinto (Canada), Tronox (South Africa), and several Chinese smelters in Panzhihua and Yunnan. Titanium slag bridges the gap between ilmenite and rutile, offering chloride-process producers a mid-tier feedstock.
[Image: Map of global titanium feedstock production regions: Australia, South Africa, Mozambique, Canada, China Panzhihua]
3. The Transmission Mechanism: From Mine to Pigment Price
TiO₂ price movements follow a recognizable pattern with three phases:
1. Phase 1 — Feedstock shock: A mine disruption, export policy change, or demand surge moves feedstock prices. Examples: Australia’s mineral sands supply tightening, Mozambique’s Moma mine flooding (2019, 2024), or Chinese environmental inspections affecting Panzhihua smelters.
2. Phase 2 — Producer cost squeeze: TiO₂ producers absorb higher feedstock costs for one to two quarters while announcing price increases to customers. Margins compress during this window.
3. Phase 3 — Price pass-through: Producers announce TiO₂ price increases (typically USD 100–300/tonne per announcement round). Buyers see contract and spot prices rise; distributor inventories appreciate.
The lag between feedstock movement and TiO₂ price movement is typically 1–2 quarters for spot markets and 2–3 quarters for contract pricing. Buyers who monitor feedstock markets can anticipate TiO₂ price moves before they are announced.
[Image: Timeline chart showing the 3-phase transmission: feedstock shock → producer squeeze → price pass-through with 1-2 quarter lag]
4. Supply Dynamics in Key Mining Regions
Australia: The Benchmark Supplier
Australia remains the world’s largest ilmenite exporter and a major rutile producer. Key dynamics:
- • Resource depletion: Several long-running mineral sands operations are approaching the end of their mine life, and new project development has been slow due to permitting hurdles
- • Consolidation: The sector has consolidated into fewer, larger players, reducing supply flexibility
- • Export orientation: Australian feedstock is largely exported to China and other Asian TiO₂ producers, making its pricing sensitive to Chinese demand
Outlook: Australian ilmenite supply is expected to remain tight over 2026–2028 as older mines wind down faster than new projects (e.g., the Thunderbird project) ramp up. Expect structural upward pressure on ilmenite prices.
Mozambique: The Growth Story
Mozambique’s Moma mine (Kenmare Resources) is one of the world’s largest titanium feedstock operations. Its recent history illustrates the fragility of supply concentration:
- • 2024 disruption: Heavy rainfall and flooding at Moma in late 2024 severely disrupted mining and transport, contributing to global ilmenite supply tightness
- • Expansion: Kenmare has invested in expansion projects to raise output; however, weather risk remains a structural vulnerability
Outlook: Mozambique will remain a critical supplier, but its weather-exposed coastal operations introduce recurring supply volatility. Buyers should treat Mozambican feedstock as a swing factor in price forecasts.
China’s Panzhihua Region: The Domestic Engine
The Panzhihua-Xichang (攀西) region holds China’s largest vanadium-titanium magnetite reserves and supplies the majority of China’s domestic ilmenite. Dynamics to watch:
- • Environmental regulation: Stricter environmental inspections and carbon constraints have periodically curtailed local smelting capacity, tightening domestic titanium slag supply
- • Cost floor: Panzhihua ilmenite production costs are relatively high compared to Australian beach sands; this sets a floor under Chinese TiO₂ production costs
- • Self-sufficiency push: China’s TiO₂ producers have increased domestic feedstock usage, reducing dependence on imports but also making Chinese TiO₂ pricing more sensitive to Panzhihua supply conditions
[Image: Photo or diagram of Panzhihua vanadium-titanium magnetite mining area with smelting operations]
5. Other Cost Drivers Beyond Feedstock
Energy Prices
TiO₂ production is energy-intensive. Calcination kilns (sulfate process) and chlorination reactors (chloride process) consume substantial electricity and fuel. European producers were hit particularly hard by the 2022 energy crisis; Chinese producers benefit from relatively lower industrial electricity rates but face rising coal costs. Energy typically accounts for 15–20% of production cost, making TiO₂ prices sensitive to regional energy price swings.
Sulfuric Acid and Chlorine
The sulfate process consumes 2.5–4 tonnes of sulfuric acid per tonne of TiO₂. Acid prices are cyclical, influenced by the fertilizer industry (the largest acid consumer) and by smelter by-product supply. Chloride-process producers depend on chlorine, whose availability is tied to the chlor-alkali industry and caustic soda demand.
Freight and Logistics
Ocean freight costs add USD 50–150/tonne to delivered TiO₂ prices depending on route. Container rate spikes (as seen in 2021 and again in 2024–2025 with Red Sea disruptions) directly inflate CIF prices for importers in Southeast Asia, the Middle East, and Latin America.
6. What to Expect: 2026–2027 Outlook
Based on current supply-demand fundamentals, here is a scenario-based outlook for TiO₂ raw material costs:
|
Scenario |
Feedstock Supply |
TiO₂ Price Implication |
|
Base case (60%) |
Gradual Australian decline offset by Mozambique recovery and stable Panzhihua output |
Moderate upward drift: +3–6% over 12 months |
|
Tight case (25%) |
Mozambique weather disruption or major Australian project delay; Panzhihua environmental curtailment |
Sharp increase: +10–20% within 2 quarters |
|
Soft case (15%) |
New supply (e.g., expanded African or Australian projects) comes online faster than expected; weak global paint demand |
Flat to declining: −5 to 0% |
The balance of risks points upward. Structural supply tightness in titanium feedstocks — driven by mine depletion, permitting delays, and weather exposure — is not being offset by sufficient new capacity. Buyers should plan for higher feedstock-driven TiO₂ costs over the next 12–24 months, while remaining alert to demand-side shocks that could temporarily soften prices.
[Image: 12-month TiO₂ price forecast chart with scenario bands (base/tight/soft)]
7. Purchasing Strategies for a Volatile Cost Environment
Given persistent raw material cost volatility, TiO₂ buyers should adopt strategies that reduce exposure to price spikes:
4. Diversify suppliers: Maintain at least two approved TiO₂ suppliers in different regions. If one producer faces feedstock-driven cost pressure, the other may hold pricing steady.
5. Use formula-based contracts: Negotiate contracts where TiO₂ pricing is indexed to published feedstock indices (ilmenite, rutile, energy). This makes cost pass-through transparent and reduces negotiation friction.
6. Time purchases around the lag: Since TiO₂ prices lag feedstock by 1–2 quarters, buying during the feedstock-shock phase (before pass-through) can lock in lower prices.
7. Build strategic inventory: In a rising market, holding 4–8 weeks of extra inventory protects against announced price increases. In a falling market, keep inventory lean.
8. Monitor leading indicators: Track weekly ilmenite and rutile price reports, quarterly production updates from major miners, and TiO₂ producer announcements. A simple dashboard of these signals gives you a 1–2 quarter early warning.
[Image: Dashboard mockup showing key TiO₂ cost leading indicators: ilmenite price, rutile price, freight index, producer announcements]
Conclusion
TiO₂ raw material costs are not random — they are the product of a transparent, if complex, transmission chain from titanium mines to pigment producers to end buyers. Feedstock supply dynamics in Australia, Mozambique, and China’s Panzhihua region, combined with energy and logistics costs, determine the cost floor that TiO₂ prices ultimately rest on.
The structural outlook points to continued upward pressure on feedstock costs over the next 12–24 months, driven by mine depletion and supply concentration. Buyers who monitor leading indicators, diversify supply, and use formula-based contracting will be best positioned to manage this volatility.
At SUN BANG, our integrated supply relationships with domestic feedstock producers in Panzhihua and Yunnan, combined with our two production bases (220,000 tonnes/year combined capacity), help stabilize our raw material costs and protect customers from the worst of feedstock price swings. Contact our sales team to discuss fixed-price or formula-based supply agreements for 2026–2027.
About the Author
[Author] Wang Leyang — Technical Application Specialist, SUN BANG TiO2
10+ years of hands-on experience in titanium dioxide technical application across coatings, plastics, rubber, and paper industries. Specializes in rutile and anatase TiO2 performance optimization, grade selection, and global compliance standards. Has supported procurement and technical teams across 20+ countries in selecting the right TiO2 products for their manufacturing processes.
LinkedIn: linkedin.com/company/zhongyuan-shengbang-xiamen-technology-co-ltd
Facebook: facebook.com/share/18Vsc4d4Wy
Post time: Aug-12-2026


